"What we've got here is a failure to communicate." In the 1967 Paul Newman movie classic Cool Hand Luke, that memorable line is uttered by the character "Captain" (head of the chain gang) to justify beating Cool Hand Luke, played by Newman. Captain of Road Prison 36 has just told Luke that he is wearing chains for his good—to which the prisoner cleverly responds, "Wish you'd stop bein' so good to me, Cap'n."
When the Captain spoke this line to Paul Newman, he used his vocal cords and air from his lungs to create unique "air vibrations." Those air vibrations traveled through space and collided with Paul's eardrum where they went through a digital transformation of sorts. This action triggered thoughts, which he then used to speak his famous line with high drama and conviction. Those air vibrations, if you could see them, would resemble a squiggly line plotted in the form of a wave on paper. That squiggly line is called analog data and arguably one of the oldest types of data in the history of the world.
The average person does not spend much time thinking about the miracle of, or the mechanics of speech as they are focused on sound and meaning. By contrast in today's world, engineers care very much about the mechanics and the math behind analog data. It turns out they are using massive amounts of analog data to build incredibly complex devices, for example, cell phones, automobiles, and jet engines.
Just like the average person that does not care about the mechanics of sound, engineers do not want to focus on the mechanics of generating and capturing millions of analog waves. But, they do require the data from hundreds of thousands of sensors producing analog data over time. This data is vital for calculations and analysis necessary to do proper engineering on products.
The evolution of technologies to perform the acquisition, transformation and transportation of an analog wave have accelerated the exchange of information on massive scales never seen before. It has also created a tsunami of sensor data that now needs to be transformed, managed and analyzed. This data, known as Time-Series Data is used to measure physical properties producing a series of floating-point numbers visualized graphically.
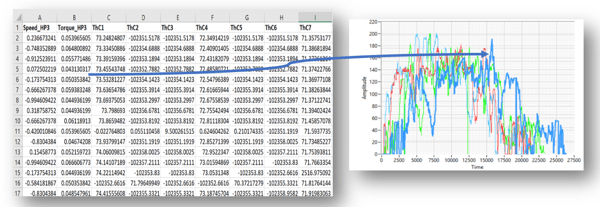
Time-series data accumulates very quickly (For example, a single connected car will collect 25GB of data per hour). All of this activity is begging for new and better tools to handle the onslaught of sensor data.
Standard databases and data management techniques do not enable the speed, or the micro-access required by engineers. Engineers need the ability to sift through mounds of numbers to find critical events allowing swift improvement of the end product under development. Instead, these engineers become ministers of spreadsheets that get lost on desktops and servers. In today's world, the value of this information is immense and is pushing companies to recognize that sensor data can be a valuable asset and should not be lost in a sea of floating points held captive on a desktop. Visionaries in the world of development are pushing the data envelope and asking questions about new ways to use this data to speed innovation and leaving the world of managing this data to other experts.
Why should you care about Time-Series data? There are many reasons, however at the highest level let me list three things, and in subsequent blog posts we will elaborate on these points:
-
Time-Series data is among the fastest growing category of data today.
-
Time-series data creates new insights by introducing efficiencies into the product life cycle.
-
These efficiencies result in the need for critical and timely decisions to speed innovation.
Perhaps this is just another step along the way in the evolution of data. But, make no mistake, for a car to drive by itself, and for spaceships to travel to Mars, better tools and techniques are required to make sense of sensor data.